AMENDMENT NO. 2023-1 TO
ANI PHARMACEUTICALS, INC. AMENDED AND RESTATED 2022 STOCK INCENTIVE PLAN
(Amended on March 28, 2024)
1.Purpose of Plan.
Effective , 2023
WHEREAS,The purpose of the ANI Pharmaceuticals, Inc., a Delaware corporation (the “Company”), maintains the Company’s Amended and Restated 2022 Stock Incentive Plan (this “Plan”) is to advance the interests of ANI Pharmaceuticals, Inc. (the “Plan”“Company”) for the benefit of eligible employees ofand its stockholders by enabling the Company and subsidiaries, non-employee members of the Board,its Subsidiaries to attract and other service providers whoretain qualified persons to perform services for the Company orand its subsidiaries; and
WHEREAS,Subsidiaries by providing an incentive to such individuals through opportunities for equity participation in the Company, desiresand by rewarding such individuals who contribute to amend the Planachievement of the Company’s economic objectives.
2. Definitions.
The following terms will have the meanings set forth below, unless the context clearly otherwise requires:
2.1 “Board” means the Board of Directors of the Company.
2.2 “Broker Exercise Notice” means a written notice pursuant to increase the totalwhich a Participant, upon exercise of an Option, irrevocably instructs a broker or dealer to sell a sufficient number of shares or loan a sufficient amount of money to pay all or a portion of the exercise price of the Option and/or any related withholding tax obligations and remit such sums to the Company and directs the Company to deliver stock certificates to be issued upon such exercise directly to such broker or dealer or their nominee.
2.3 “Cause” means “cause” as defined in any employment or other agreement or policy applicable to the Participant, or if no such agreement or policy exists, will mean (i) any crime involving dishonesty, fraud, misrepresentation, embezzlement or deliberate injury or attempted injury, in each case related to the Company or any Subsidiary, (ii) any unlawful or criminal activity of a serious nature, (iii) any intentional and deliberate breach of a duty or duties that, individually or in the aggregate, are material in relation to the Participant’s overall duties, or (iv) any material breach of any employment, service, confidentiality, non-compete or non-solicitation agreement entered into with the Company or any Subsidiary..
2.4 “Change in Control” means an event described in Section 14.1 of the Plan; provided, however, if under an Incentive Award that is subject to Section 409A of the Code, payment or settlement is triggered by a Change in Control, such that such payment or settlement would subject the Incentive Award to taxation under Section 409A of the Code, the term Change in Control will mean a change in the ownership or effective control of the Company, or in the ownership of a substantial portion of the assets of the Company, as such term is defined in Section 409A of the Code.
2.5 “Code” means the Internal Revenue Code of 1986, as amended (including, when the context requires, all regulations, interpretations and rulings issued thereunder).
2.6 “Committee” means the group of individuals administering the Plan, as provided in Section 3 of the Plan.
2.7 “Common Stock” means the common stock of the Company, that may be issuedpar value $0.0001 per share, or transferred under the Plan, to clarify the maximum number and kind of shares of common stock or other securities into which such Common Stock may be changed in accordance with Section 4.3 of the Plan.
2.8 “Disability” means the disability of the Participant such as would entitle the Participant to receive disability income benefits pursuant to the long-term disability plan of the Company that may be grantedor Subsidiary then covering the Participant or, if no such plan exists or is applicable to the Participant, the permanent and total disability of the Participant within the meaning of Section 22(e)(3) of the Code; provided, however, if distribution of an Incentive Award subject to Section 409A of the Code is triggered by an Eligible Recipient’s Disability, such term will mean that the Eligible Recipient is disabled as defined by Section 409A of the Code and the regulations and rulings issued thereunder.
2.9 “Effective Date” means March 28, 2024, except as to Section 4.1(a), which shall be effective if, when and to the extent approved by the Company’s stockholders at the next annual meeting of the stockholders.
2.10 “Eligible Recipients” means (a) for the purposes of granting Incentive Stock Options, all employees (including, without limitation, officers and directors who are also employees) of the Company or any
Subsidiary and (b) for the purposes of granting Non-Statutory Stock Options and other Incentive Awards, all employees (including, without limitation, officers and directors who are also employees) of the Company or any Subsidiary and any non-employee directors, consultants, advisors and independent contractors of the Company or any Subsidiary. Notwithstanding the foregoing, an Eligible Person shall also include any individual who is expected to become an employee of the Company or any Subsidiary or a non-employee director, consultant, advisor or independent contractor of the Company or any Subsidiary within a reasonable period of time after the grant of an Incentive Award (other than an Incentive Stock Option); provided that any Award granted to any such individual shall be automatically terminated and cancelled without consideration if the individual does not begin performing services for the Company or any Subsidiary within twelve (12) months after the date such Incentive Award is granted.
2.11 “Exchange Act” means the Securities Exchange Act of 1934, as amended.
2.12 “Fair Market Value” means, with respect to the Common Stock, as of any date: (i) the closing sale price of the Common Stock at the end of the regular trading session, as reported by The NASDAQ Stock Market, The New York Stock Exchange, The American Stock Exchange or any national exchange on which the Common Stock is then listed or quoted (or, if no shares were traded on such date, as of the next preceding date on which there was such a trade); or (ii) if the Common Stock is not so listed, admitted to unlisted trading privileges, or reported on any national exchange or, the closing sale price as of such date at the end of the regular trading session, as reported by OTC Bulletin Board or the Pink Sheets LLC, or other comparable service (or, if no shares were traded or quoted on such date, as of the next preceding date on which there was such a trade or quote); or (iii) if the Common Stock is not so listed or reported, such price as the Committee determines in good faith, and consistent with the definition of “fair market value” under Section 409A of the Code.
2.13 “Incentive Award” means an Option, Stock Appreciation Right, Restricted Stock Award, Stock Unit Award, Performance Award or Stock Bonus granted to an Eligible Recipient pursuant to the Plan.
2.14“ Incentive Stock Option” means a right to purchase shares of Common Stock granted to an Eligible Recipient pursuant to Section 6 of the Plan that qualifies as an “incentive stock options”option” within the meaning of Section 422 of the Internal RevenueCode.
2.15 “Non-Statutory Stock Option” means a right to purchase shares of Common Stock granted to an Eligible Recipient pursuant to Section 6 of the Plan that does not qualify as an Incentive Stock Option.
2.16 “Option” means an Incentive Stock Option or a Non-Statutory Stock Option.
2.17 “Participant” means an Eligible Recipient who receives one or more Incentive Awards under the Plan.
2.18 “Performance Award” means a right granted to an Eligible Recipient pursuant to Section 10 of the Plan to receive an amount of cash, a number of shares of Common Stock, or a combination of both, contingent upon achievement of specified performance objectives during a specified period. A Performance Award is also commonly referred to as a “performance unit.”
2.19 “Previously Acquired Shares” means shares of Common Stock that are already owned by the Participant or, with respect to any Incentive Award, that are to be issued to the Participant upon the grant, exercise or vesting of such Incentive Award.
2.20 “Prior Plan Restatement” means any prior amendment and restatement of ANI Pharmaceuticals, Inc. 2008 Stock Incentive Plan.
2.21 “Restricted Stock Award” means an award of shares of Common Stock granted to an Eligible Recipient pursuant to Section 8 of the Plan that are subject to restrictions on transferability and/or a risk of forfeiture.
2.22 “Retirement” means termination of employment or service at age 55 or older and completion of at least ten years of continuous service.
2.23 “Securities Act” means the Securities Act of 1933, as amended.
2.24 “Stock Appreciation Right” means a right granted to an Eligible Recipient pursuant to Section 7 of the Plan to receive a payment from the Company, in the form of shares of Common Stock, cash or a combination of
both, equal to the difference between the Fair Market Value of one or more shares of Common Stock and a specified exercise price of such shares.
2.25 “Stock Bonus” means an award of shares of Common Stock granted to an Eligible Recipient pursuant to Section 11 of the Plan.
2.26 “Stock Unit Award” means a right granted to an Eligible Recipient pursuant to Section 9 of the Plan to receive the Fair Market Value of one or more shares of Common Stock, payable in cash, shares of Common Stock, or a combination of both, the payment, issuance, retention and/or vesting of which is subject to the satisfaction of specified conditions, which may include achievement of specified performance objectives. A Stock Unit Award when payable in shares of Common Stock is also commonly referred to as a “restricted stock unit.”
2.27 “Subsidiary” means any entity that is directly or indirectly controlled by the Company or any entity in which the Company has a significant equity interest, as determined by the Committee, provided the Company has a “controlling interest” in the Subsidiary as defined in Treas. Reg. Sec. 1.409A-1(b)(5)(iii)(E)(1).
2.28 “Tax Date” means the date any withholding tax obligation arises under the Code for a Participant with respect to an Incentive Award.
3. Plan Administration.
3.1 The Committee. The Plan will be administered by the Board or by a committee of 1986,the Board. So long as amended (the “Code”)the Company has a class of its equity securities registered under Section 12 of the Exchange Act, any committee administering the Plan will consist solely of two or more members of the Board who are “non-employee directors” within the meaning of Rule 16b-3 under the Exchange Act and who are “independent” as required by the listing standards of The NASDAQ Stock Market (or other applicable exchange or market on which the Company’s Common Stock may be traded or quoted). Such a committee, if established, will act by majority approval of the members (but may also take action by the written consent of all of the members of such committee), and a majority of the members of such a committee will constitute a quorum. As used in the Plan, “Committee” will refer to limit the Committee’sBoard or to such a committee, if established. To the extent consistent with applicable corporate law of the Company’s jurisdiction of incorporation, the Committee may delegate to any officers of the Company the duties, power and authority of the Committee under the Plan pursuant to such conditions or limitations as the Committee may establish; provided, however, that only the Committee may exercise such duties, power and authority with respect to Eligible Recipients who are subject to Section 16 of the Exchange Act. The Committee may exercise its duties, power and authority under the Plan in its sole and absolute discretion without the consent of any Participant or other party, unless the Plan specifically provides otherwise. Each determination, interpretation or other action made or taken by the Committee pursuant to the provisions of the Plan will be final, conclusive and binding for all purposes and on all persons, and no member of the Committee will be liable for any action or determination made in good faith with respect to the Plan or any Incentive Award granted under the Plan.
3.2 Authority of the Committee.
(a) In accordance with and subject to the provisions of the Plan, the Committee will have the authority to determine all provisions of Incentive Awards as the Committee may deem necessary or desirable and as consistent with the terms of the Plan, including, without limitation, the following: (i) the Eligible Recipients to be selected as Participants; (ii) the nature and extent of the Incentive Awards to be made to each Participant (including the number of shares of Common Stock to be subject to each Incentive Award, any exercise price, the manner in which Incentive Awards will vest or become exercisable and whether Incentive Awards will be granted in tandem with other Incentive Awards) and the form of written agreement, if any, evidencing such Incentive Award; (iii) the time or times when Incentive Awards will be granted; (iv) the duration of each Incentive Award; and (v) the restrictions and other conditions to which the payment or vesting of Incentive Awards may be subject. In addition, the Committee will have the authority under the Plan in its sole discretion to determinepay the treatmenteconomic value of performance-basedany Incentive Award in the form of cash, Common Stock or any combination of both.
(b) Subject to Section 3.2(d) of the Plan, the Committee will have the authority under the Plan to amend or modify the terms of any outstanding Incentive Award in any manner, including, without limitation, the authority to modify the number of shares or other terms and conditions of an Incentive Award, extend the term of an Incentive Award, accelerate the exercisability or vesting awards uponor otherwise terminate any restrictions relating to an Incentive Award, accept the surrender of any outstanding Incentive Award or, to the extent not previously exercised or vested, authorize the grant of new Incentive Awards in substitution for surrendered Incentive Awards; provided, however that (i) the amended or modified terms must otherwise be permitted by the Plan as then in effect, and may not subject any Participant to taxation under Section 409A of the Code and (ii) any Participant adversely affected by such amended or modified terms must have consented to such amendment or modification.
(c) In the event of (i) any reorganization, merger, consolidation, recapitalization, liquidation, reclassification, stock dividend, stock split, combination of shares, rights offering, extraordinary dividend or divestiture (including a spin-off) or any other similar change in control;corporate structure or shares; (ii) any purchase, acquisition, sale, disposition or write-down of a significant amount of assets or a significant business; (iii) any change in accounting principles or practices, tax laws or other such laws or provisions affecting reported results; (iv) any uninsured catastrophic losses or extraordinary non-recurring items as described in Financial Accounting Standards Board Accounting Standards Codification 225, Income Statement or in management’s discussion and
NOW, THEREFORE, analysis of financial performance appearing in accordancethe Company’s annual report to stockholders for the applicable year; or (v) any other similar change, in each case with respect to the Company or any other entity whose performance is relevant to the grant or vesting of an Incentive Award, the Committee (or, if the Company is not the surviving corporation in any such transaction, the board of directors of the surviving corporation) may, without the consent of any affected Participant, amend or modify the vesting criteria (including any performance objectives) of any outstanding Incentive Award that is based in whole or in part on the financial performance of the Company (or any Subsidiary or division or other subunit thereof) or such other entity so as equitably to reflect such event, with the foregoingdesired result that the criteria for evaluating such financial performance of the Company or such other entity will be substantially the same (in the sole discretion of the Committee or the board of directors of the surviving corporation) following such event as prior to such event; provided, however, that the amended or modified terms are permitted by the Plan as then in effect, including the limitations in Section 3.2(a) and subject to3.2(b).
(d) Notwithstanding any other provision of this Plan other than Section 4.3, the Committee may not, without prior approval of the Company’s stockholders, seek to effect any re-pricing of any previously granted, “underwater” Option or Stock Appreciation Right by: (i) amending or modifying the terms of the Option or Stock Appreciation Right to lower the exercise price; (ii) canceling the underwater Option or Stock Appreciation Right in exchange for (A) cash; (B) replacement Options or Stock Appreciation Rights having a lower exercise price; or (C) other Incentive Awards; or (iii) repurchasing the underwater Options or Stock Appreciation Rights and granting new Incentive Awards under this Plan. For purposes of this Section 3.2(d), Options and Stock Appreciation Rights will be deemed to be “underwater” at any time when the Fair Market Value of the Common Stock is less than the exercise price of the Option or Stock Appreciation Right.
(e) In addition to the authority of the Committee under Section 3.2(b) of the Plan and notwithstanding any other provision of the Plan, the Committee may, in its sole discretion, amend the terms of the Plan or Incentive Awards with respect to Participants resident outside of the United States or employed by a non-U.S. Subsidiary in order to comply with local legal requirements, to otherwise protect the Company’s or Subsidiary’s interests, or to meet objectives of the Plan, and may, where appropriate, establish one or more sub-plans (including the adoption of any required rules and regulations) for the purposes of qualifying for preferred tax treatment under foreign tax laws. The Committee shall be, and hereby is, amended as follows:have no authority, however, to take action pursuant to this Section 3.2(e) of the Plan:
1.(i) to reserve shares or grant Incentive Awards in excess of the limitations provided in Section 4.1 of the Plan; (ii) to effect any re-pricing in violation of Section 3.2(d) of the Plan; (iii) to grant Options or Stock Appreciation Rights having an exercise price in violation of Section 6.2 or 7.2 of the Plan, as the case may be; or (iv) for which stockholder approval would then be required pursuant to Section 422 of the Code or the rules of The NASDAQ Stock Market (or other applicable exchange or market on which the Company’s Common Stock may be traded or quoted). In addition, the Committee shall have no authority to grant any Incentive Award on or after April 10, 2020 that vests or becomes exercisable earlier than twelve months after such Incentive Award was granted; provided, however, that this minimum vesting condition shall not apply to (x) any Incentive Award that is hereby deleted in its entiretyoutstanding on April 9, 2020, or (y) Incentive Awards granted on or after April 10, 2020 with respect to which the aggregate number of shares issuable pursuant to such Incentive Awards do not exceed 5% of the aggregate number of shares of Common Stock reserved for issuance under the Plan as of April 10, 2020 less the sum of the number of shares of Common Stock issued under the Plan prior to April 10, 2020 and replaced with the following:number of shares of Common Stock underlying Incentive Awards that were outstanding as of April 10, 2020 (collectively, “Exempted Awards”).
“4. Shares Available for Issuance.
4.1 Maximum Number of Shares Available; Certain Restrictions on Awards.
(a) Subject to adjustment as provided in Section 4.3 of the Plan, the maximum number of shares of Common Stock that will be available for issuance under the Plan will be the sum of: (x) 4,150,000,4,900,000, plus up to an additional 750,0001,610,000 subject to approval of the Company’s stockholders at the next annual meeting of the stockholders, which if approved in full will result in a new aggregate share reserve of 4,900,000;6,510,000; (y) the number of shares of Common Stock subject to Incentive Awards granted under any Prior Plan Restatement that remain outstanding as of the Effective Date but only to the extent that such outstanding Incentive Awards are forfeited,
expire or otherwise terminate without the issuance of such shares of Common Stock; and (z) the number of shares issued or Incentive Awards granted under the Plan in connection with the settlement, assumption or substitution of outstanding awards as a condition of the Company and/or any Subsidiary(ies) acquiring, merging or consolidating with another entity.
(b) The shares available for issuance under the Plan may, at the election of the Committee, be either treasury shares or shares authorized but unissued, and, if treasury shares are used, all references in the Plan to the issuance of shares will, for corporate law purposes, be deemed to mean the transfer of shares from treasury.
(c) Subject to adjustment as described below in Section 4.2 and 4.3 below, the aggregate number of shares of Common Stock that may be issued or transferred under the Plan pursuant to Incentive Stock Options shall not exceed 4,900,0006,510,000 shares of Company Stock.”
(d) Subject to adjustment as described below in Section 4.2 and 4.3 below, the maximum aggregate grant date value of shares of Common Stock subject to Incentive Awards granted to any director during any calendar year, taken together with any cash fees earned by such director for services rendered during the calendar year, shall not exceed $750,000 in total value. For purposes of this limit, the value of such Incentive Awards shall be calculated based on the grant date fair value of such Incentive Awards for financial reporting purposes. The limitation described in this paragraph shall be increased to $1,000,000 with respect to Incentive Awards made to a director during the calendar year in which the director’s initial term commences.”
2.4.2 Accounting for Incentive Awards. Shares of Common Stock that are issued under the Plan or that are potentially issuable pursuant to outstanding Incentive Awards will be applied to reduce the maximum number of shares of Common Stock remaining available for issuance under the Plan. All shares so subtracted from the amount available under the Plan with respect to an Incentive Award (other than Incentive Awards granted pursuant to Section 4.1(c)) that lapses, expires, is forfeited (including issued shares forfeited under a Restricted Stock Award) or for any reason is terminated unexercised or unvested or is settled or paid in cash or any form other than shares of Common Stock will automatically again become available for issuance under the Plan; provided, however, that (i) any shares which would have been issued upon any exercise of an Option but for the fact that the exercise price was paid by a “net exercise” pursuant to Section 6.4(b) of the Plan or the tender or attestation as to ownership of Previously Acquired Shares pursuant to Section 6.4(a) of the Plan will not again become available for issuance under the Plan; (ii) the full number of shares of Common Stock subject to a Stock Appreciation Right granted that are settled by the issuance of shares of Common Stock will be counted against the shares authorized for issuance under this Plan, regardless of the number of shares actually issued upon settlement of such Stock Appreciation Right, and will not again become available for issuance under the Plan; and (iii) shares withheld by the Company to pay the exercise price of any Incentive Award or satisfy any tax withholding obligation will not again become available for issuance under the Plan. Any shares of Common Stock repurchased by the Company on the open market using the proceeds from the exercise of an Incentive Award will not increase the number of shares available for future grant of Incentive Awards. Subject to the foregoing, any shares of Common Stock related to Incentive Awards under this Plan or under any Prior Plan Restatement that terminate by expiration, forfeiture, cancellation or otherwise without the issuance of shares of Common Stock, or are settled in cash in lieu of shares, or are exchanged with the Committee’s permission, prior to the issuance of shares, for Incentive Awards not involving shares, will be available again for grant under this Plan.
4.3 Adjustments to Shares and Incentive Awards. In the event that the Committee determines that any reorganization, merger, consolidation, recapitalization, liquidation, reclassification, stock dividend, stock split, combination of shares, rights offering, divestiture or extraordinary dividend (including a spin-off) or any other similar corporate transaction or change in the corporate structure or shares of the Company affects the Common Stock, such that an adjustment is appropriate in order to prevent dilution or enlargement of the benefits or potential benefits intended to be provided or made available under the Plan, then the Committee shall, in such manner as it may deem equitable, adjust any or all of (a) the number and kind of securities or other property with respect to which Incentive Awards may be granted, (b) the number and kind of securities or property subject to outstanding Incentive Awards, and (c) the exercise price of outstanding Options and Stock Appreciation Rights or, if it deems it appropriate, the Committee may make provision for a cash payment to the holders of outstanding Incentive Awards. Notwithstanding the foregoing, no such adjustment shall be authorized with respect to any Options or Stock Appreciation Rights to the extent that such adjustment would cause the Option or Stock Appreciation Rights (determined as if such Option or Stock Appreciation Right was an Incentive Stock Option) to violate Section 424(a) of the Code or otherwise subject any Participant to taxation under Section 409A of the Code; and provided further that the number of Shares subject to any Award denominated in Shares shall always be a whole number.
5. Participation.
Participants in the Plan will be those Eligible Recipients who, in the judgment of the Committee, have contributed, are contributing or are expected to contribute to the achievement of economic objectives of the
Company or its Subsidiaries. Eligible Recipients may be granted from time to time one or more Incentive Awards, singly or in combination or in tandem with other Incentive Awards, as may be determined by the Committee in its sole discretion. Incentive Awards will be deemed to be granted as of the date specified in the grant resolution of the Committee, which date will be the date of any related agreement with the Participant.
6. Options.
6.1 Grant. An Eligible Recipient may be granted one or more Options under the Plan, and such Options will be subject to such terms and conditions, consistent with the other provisions of the Plan, as may be determined by the Committee in its sole discretion. The bulletsCommittee may designate whether an Option is to be considered an Incentive Stock Option or a Non-Statutory Stock Option. To the extent that any Incentive Stock Option (or portion thereof) granted under the Plan ceases for any reason to qualify as an “incentive stock option” for purposes of Section 422 of the Code, such Incentive Stock Option (or portion thereof) will continue to be outstanding for purposes of the Plan but will thereafter be deemed to be a Non-Statutory Stock Option. Options may be granted to an Eligible Recipient for services provided to a Subsidiary only if, with respect to such Eligible Recipient, the underlying shares of Common Stock constitute “service recipient stock” within the meaning of Treas. Reg. Section 1.409A-1(b)(5)(iii).
6.2 Exercise Price. The per share price to be paid by a Participant upon exercise of an Option will be determined by the Committee in its discretion at the time of the Option grant, provided that such price will not be less than 100% of the Fair Market Value of one share of Common Stock on the date of grant (or 110% of the Fair Market Value of one share of Common Stock on the date of grant of an Incentive Stock Option if, at the time the Incentive Stock Option is granted, the Participant owns, directly or indirectly, more than 10% of the total combined voting power of all classes of stock of the Company or any parent or subsidiary corporation of the Company). Notwithstanding the foregoing, to the extent that Options are granted under the Plan as a result of the Company’s assumption or substitution of options issued by any acquired, merged or consolidated entity, the exercise price for such Options shall be the price determined by the Committee pursuant to the conversion terms applicable to the transaction.
6.3 Exercisability and Duration. An Option will become exercisable at such times and in such installments and upon such terms and conditions as may be determined by the Committee in its sole discretion at the time of grant (including without limitation (i) the achievement of one or more specified performance objectives; and/or that (ii) the Participant remain in the continuous employ or service of the Company or a Subsidiary for a certain period); provided, however, that no Option may be exercisable after ten (10) years from its date of grant (five years from its date of grant in the case of an Incentive Stock Option if, at the time the Incentive Stock Option is granted, the Participant owns, directly or indirectly, more than 10% of the total combined voting power of all classes of stock of the Company or any parent or subsidiary corporation of the Company).
6.4 Payment of Exercise Price.
(a) The total purchase price of the shares to be purchased upon exercise of an Option will be paid entirely in cash (including check, bank draft or money order); provided, however, that the Committee, in its sole discretion and upon terms and conditions established by the Committee, may allow such payments to be made, in whole or in part, by (i) tender of a Broker Exercise Notice; (ii) by tender, or attestation as to ownership, of Previously Acquired Shares that are acceptable to the Committee; (iii) by a “net exercise” of the Option (as further described in paragraph (b), below); or (iv) by a combination of such methods.
(b) In the case of a “net exercise” of an Option, the Company will not require a payment of the exercise price of the Option from the Participant but will reduce the number of shares of Common Stock issued upon the exercise by the largest number of whole shares that has a Fair Market Value on the exercise date that does not exceed the aggregate exercise price for the shares exercised under this method. Shares of Common Stock will no longer be outstanding under an Option (and will therefore not thereafter be exercisable) following the exercise of such Option to the extent of (i) shares used to pay the exercise price of an Option under the “net exercise,” (ii) shares actually delivered to the Participant as a result of such exercise and (iii) any shares withheld for purposes of tax withholding pursuant to Section 13.1 of the Plan.
(c) Previously Acquired Shares tendered or covered by an attestation as payment of an Option exercise price will be valued at their Fair Market Value on the exercise date.
6.5 Manner of Exercise. An Option may be exercised by a Participant in whole or in part from time to time, subject to the conditions contained in the Plan and in the agreement evidencing such Option, by delivery in
person, by facsimile or electronic transmission or through the mail of written notice of exercise to the Company at its principal executive office in Baudette, Minnesota and by paying in full the total exercise price for the shares of Common Stock to be purchased in accordance with Section 6.4 of the Plan.
7. Stock Appreciation Rights.
7.1 Grant. An Eligible Recipient may be granted one or more Stock Appreciation Rights under the Plan, and such Stock Appreciation Rights will be subject to such terms and conditions, consistent with the other provisions of the Plan, as may be determined by the Committee in its sole discretion. The Committee will have the sole discretion to determine the form in which payment of the economic value of Stock Appreciation Rights will be made to a Participant (i.e., cash, shares of Common Stock or any combination thereof) or to consent to or disapprove the election by a Participant of the form of such payment. Stock Appreciation Rights may be granted to an Eligible Recipient for services provided to a Subsidiary only if, with respect to such Eligible Recipient, the underlying shares of Common Stock constitute “service recipient stock” within the meaning of Treas. Reg. Section 1.409A-1(b)(5)(iii).
7.2 Exercise Price. The exercise price of a Stock Appreciation Right will be determined by the Committee, in its discretion, at the date of grant but may not be less than 100% of the Fair Market Value of one share of Common Stock on the date of grant. Notwithstanding the foregoing, to the extent that Stock Appreciation Rights are granted under the Plan as a result of the Company’s assumption or substitution of stock appreciation rights issued by any acquired, merged or consolidated entity, the exercise price for such Stock Appreciation Rights shall be the price determined by the Committee pursuant to the conversion terms applicable to the transaction.
7.3 Exercisability and Duration. A Stock Appreciation Right will become exercisable at such time and in such installments as may be determined by the Committee in its sole discretion at the time of grant; provided, however, that no Stock Appreciation Right may be exercisable after ten (10) years from its date of grant. A Stock Appreciation Right will be exercised by giving notice in the same manner as for Options, as set forth in Section 14.26.5 of the Plan.
7.4 Grants in Tandem with Options. Stock Appreciation Rights may be granted alone or in addition to other Incentive Awards, or in tandem with an Option, at the time of grant of the Option. A Stock Appreciation Right granted in tandem with an Option shall cover the same number of shares of Common Stock as covered by the Option (or such lesser number as the Committee may determine), shall be exercisable at such time or times and only to the extent that the related Option is exercisable, have the same term as the Option and shall have an exercise price equal to the exercise price for the Option. Upon the exercise of a Stock Appreciation Right granted in tandem with an Option, the Option shall be canceled automatically to the extent of the number of shares covered by such exercise; conversely, upon exercise of an Option having a related Stock Appreciation Right, the Stock Appreciation Right shall be canceled automatically to the extent of the number of shares covered by the Option exercise.
8. Restricted Stock Awards.
8.1 Grant. An Eligible Recipient may be granted one or more Restricted Stock Awards under the Plan, and such Restricted Stock Awards will be subject to such terms and conditions, consistent with the other provisions of the Plan, are hereby deletedas may be determined by the Committee in their entirety and replacedits sole discretion. The Committee may impose such restrictions or conditions, not inconsistent with the following:provisions of the Plan, to the vesting of such Restricted Stock Awards as it deems appropriate, including, without limitation, (i) the achievement of one or more specified performance objectives; and/or that (ii) the Participant remain in the continuous employ or service of the Company or a Subsidiary for a certain period.
“8.2 Rights as a Stockholder; Transferability. Except as provided in Sections 8.1, 8.3, 8.4 and 15.3 of the Plan, a Participant will have all voting, dividend, liquidation and other rights with respect to shares of Common Stock issued to the Participant as a Restricted Stock Award under this Section 8 upon the Participant becoming the holder of record of such shares as if such Participant were a holder of record of shares of unrestricted Common Stock.
8.3 Dividends and Distributions. Unless the Committee determines otherwise in its sole discretion (either in the agreement evidencing the Restricted Stock Award at the time of grant or at any time after the grant of the Restricted Stock Award), any dividends or distributions paid with respect to shares of Common Stock subject to the unvested portion of a Restricted Stock Award will be subject to the same restrictions as the shares to which such
dividends or distributions relate. The Committee will determine in its sole discretion whether any interest will be paid on such dividends or distributions.
8.4 Enforcement of Restrictions. To enforce the restrictions referred to in this Section 8, the Committee may place a legend on the stock certificates referring to such restrictions and may require the Participant, until the restrictions have lapsed, to keep the stock certificates, together with duly endorsed stock powers, in the custody of the Company or its transfer agent, or to maintain evidence of stock ownership, together with duly endorsed stock powers, in a certificate less book-entry stock account with the Company’s transfer agent.
9. Stock Unit Awards.
An Eligible Recipient may be granted one or more Stock Unit Awards under the Plan, and such Stock Unit Awards will be subject to such terms and conditions, consistent with the other provisions of the Plan, as may be determined by the Committee in its sole discretion. The Committee may impose such restrictions or conditions, not inconsistent with the provisions of the Plan, to the payment, issuance, retention and/or vesting of such Stock Unit Awards as it deems appropriate, including, without limitation, (i) the achievement of one or more specified performance objectives; and/or that (ii) the Participant remain in the continuous employ or service of the Company or a Subsidiary for a certain period.
10. Performance Awards.
An Eligible Recipient may be granted one or more Performance Awards under the Plan, and such Performance Awards will be subject to such terms and conditions, if any, consistent with the other provisions of the Plan, as may be determined by the Committee in its sole discretion, including, but not limited to, the achievement of one or more specified performance objectives.
11. Stock Bonuses.
An Eligible Recipient may be granted one or more Stock Bonuses under the Plan, and such Stock Bonuses will be subject to such terms and conditions, if any, consistent with the other provisions of the Plan, as may be determined by the Committee in its sole discretion, including, but not limited to, the achievement of one or more specified performance objectives.
12. Effect of Termination of Employment or Other Service. The following provisions shall apply upon termination of a Participant’s employment or other service with the Company and all Subsidiaries, except to the extent that the Committee provides otherwise in an agreement evidencing an Incentive Award at the time of grant or determines pursuant to Section 12.3 of the Plan.
12.1 Termination Due to Death, Disability or Retirement. In the event a Participant’s employment or other service with the Company and all Subsidiaries is terminated by reason of death, Disability or Retirement:
(a) All outstanding Options and Stock Appreciation Rights then held by the Participant will, to the extent exercisable as of such termination, remain exercisable in full for a period of one year after such termination (but in no event after the expiration date of any such Option or Stock Appreciation Right). Options and Stock Appreciation Rights not exercisable as of such termination will be forfeited and terminate;
(b) All Restricted Stock Awards then held by the Participant that have not vested as of such termination will be terminated and forfeited; and
(c) All outstanding but unpaid Stock Unit Awards, Performance Awards and Stock Bonuses then held by the Participant will be terminated and forfeited.
12.2 Termination for Reasons Other than Death, Disability or Retirement. Subject to Section 12.4 of the Plan, in the event a Participant’s employment or other service is terminated with the Company and all Subsidiaries for any reason other than death, Disability or Retirement, or a Participant is in the employ or service of a Subsidiary and the Subsidiary ceases to be a Subsidiary of the Company (unless the Participant continues in the employ or service of the Company or another Subsidiary):
(a) All outstanding Options and Stock Appreciation Rights then held by the Participant will, to the extent exercisable as of such termination, remain exercisable in full for a period of three months after such termination (but in no event after the expiration date of any such Option or Stock Appreciation Right). Options and Stock Appreciation Rights not exercisable as of such termination will be forfeited and terminate;
(b) All Restricted Stock Awards then held by the Participant that have not vested as of such termination will be terminated and forfeited; and
(c) All outstanding but unpaid Stock Unit Awards, Performance Awards and Stock Bonuses then held by the Participant will be terminated and forfeited.
12.3 Modification of Rights Upon Termination. Notwithstanding the other provisions of this Section 12, upon a Participant’s termination of employment or other service with the Company and all Subsidiaries, the Committee may, in its sole discretion (which may be exercised at any time on or after the date of grant, including following such termination), except as provided in clause (ii), below, cause Options or Stock Appreciation Rights (or any part thereof) then held by such Participant to terminate, become or continue to become exercisable and/or remain exercisable following such termination of employment or service, and Restricted Stock Awards, Stock Unit Awards, Performance Awards or Stock Bonuses then held by such Participant to terminate, vest or become free of restrictions and conditions to payment, as the case may be, following such termination of employment or service, in each case in the manner determined by the Committee; provided, however, that any such action adversely affecting any outstanding Incentive. Award will not be effective without the consent of the affected Participant (subject to the right of the Committee to take whatever action it deems appropriate under Sections 3.2(c), 4.3 and 14 of the Plan).
12.4 Effects of Actions Constituting Cause. Notwithstanding anything in the Plan to the contrary, in the event that a Participant is determined by the Committee, acting in its sole discretion, to have committed any action which would constitute Cause as defined in Section 2.3 of the Plan, irrespective of whether such action or the Committee’s determination occurs before or after termination of such Participant’s employment with the Company or any Subsidiary, all rights of the Participant under the Plan and any agreements evidencing an Incentive Award then held by the Participant shall terminate and any unvested portion of the Incentive Award be forfeited without notice of any kind.
12.5 Determination of Termination of Employment or Other Service.
(a) The change in a Participant’s status from that of an employee of the Company or any Subsidiary to that of a non-employee consultant, director or advisor of the Company or any Subsidiary will, for purposes of the Plan, be deemed to result in a termination of such Participant’s employment with the Company and its Subsidiaries, unless the Committee otherwise determines in its sole discretion.
(b) The change in a Participant’s status from that of a non-employee consultant, director or advisor of the Company or any Subsidiary to that of an employee of the Company or any Subsidiary will not, for purposes of the Plan, be deemed to result in a termination of such Participant’s service as a non-employee consultant, director or advisor with the Company and its Subsidiaries, and such Participant will thereafter be deemed to be an employee of the Company or its Subsidiaries until such Participant’s employment is terminated, in which event such Participant will be governed by the provisions of this Plan relating to termination of employment or service (subject to paragraph (a), above).
(c) Unless the Committee otherwise determines in its sole discretion, a Participant’s employment or other service will, for purposes of the Plan, be deemed to have terminated on the date recorded on the personnel or other records of the Company or the Subsidiary for which the Participant provides employment or other service, as determined by the Committee in its sole discretion based upon such records.
(d) Notwithstanding the foregoing, if payment of an Incentive Award that is subject to Section 409A of the Code is triggered by a termination of a Participant’s employment or other service, such termination must also constitute a “separation from service” within the meaning of Section 409A of the Code, and any change in employment status that constitutes a “separation from service” under Section 409A of the Code shall be treated as a termination of employment or service, as the case may be.
12.6 Breach of Employment, Consulting, Confidentiality or Non-Compete Agreements. Notwithstanding anything in the Plan or in any Incentive Award granted hereunder to the contrary and in addition to the rights of the Committee under Section 12.4 of the Plan, the Committee in its sole discretion may cancel, rescind, withhold or otherwise limit or restrict any Incentive Award at any time in the event that a Participant materially breaches the terms of any employment, consulting, confidentiality or non-compete agreement entered into with the Company or any Subsidiary (including an employment, consulting, confidentiality or non-compete agreement made in connection with the grant of an Incentive Award), whether such breach occurs before or after termination of such Participant’s employment or other service with the Company or any Subsidiary, to the extent disgorgement or forfeiture of the Incentive Award or any amounts received under the Incentive Award is required under a policy of the Company or any successor, or its or their subsidiaries, adopted to comply with applicable requirements of law (including Section 10D of the Securities Exchange Act of 1934, as amended) or of any applicable stock exchange..
13. Payment of Withholding Taxes.
13.1 General Rules. The Company is entitled to (a) withhold and deduct from future wages of the Participant (or from other amounts that may be due and owing to the Participant from the Company or a Subsidiary), or make other arrangements for the collection of, all legally required amounts necessary to satisfy any and all federal, foreign, state and local withholding and employment-related tax requirements attributable to an Incentive Award, including, without limitation, the grant, exercise, vesting or settlement of, or payment of dividends with respect to, an Incentive Award or a disqualifying disposition of stock received upon exercise of an Incentive Stock Option; (b) withhold cash paid or payable or shares of Common Stock from the shares issued or otherwise issuable to the Participant in connection with an Incentive Award; or (c) require the Participant promptly to remit the amount of such withholding to the Company before taking any action, including issuing any shares of Common Stock, with respect to an Incentive Award. Shares of Common Stock issued or otherwise issuable to the Participant in connection with an Incentive Award that gives rise to the tax withholding obligation that are withheld for purposes of satisfying the Participant’s withholding or employment-related tax obligation, will be valued at their Fair Market Value on the Tax Date. No withholding will be effected under this Plan which exceeds the minimum statutory withholding requirements.
13.2 Special Rules. The Committee may, in its sole discretion and upon terms and conditions established by the Committee, permit or require a Participant to satisfy, in whole or in part, any withholding or employment-related tax obligation described in Section 13.1 of the Plan by withholding shares of Common Stock underlying an Incentive Award, by electing to tender, or by attestation as to ownership of, Previously Acquired Shares, by delivery of a Broker Exercise Notice or a combination of such methods. For purposes of satisfying a Participant’s withholding or employment-related tax obligation, shares of Common Stock withheld by the Company or Previously Acquired Shares tendered or covered by an attestation will be valued at their Fair Market Value on the Tax Date.
14. Change in Control.
14.1 A “Change in Control” shall be deemed to have occurred if the event set forth in any one of the following paragraphs shall have occurred:
(a) the sale, lease, exchange or other transfer, directly or indirectly, of substantially all of the assets of the Company (in one transaction or in a series of related transactions) to a person or entity that is not controlled by the Company;
(b) the approval by the stockholders of the Company of any plan or proposal for the liquidation or dissolution of the Company;
(c) any person becomes after the effective date of the Plan the “beneficial owner” (as defined in Rule 13d-3 under the Exchange Act), directly or indirectly, of (A) 20% or more, but not 50% or more, of the combined voting power of the Company’s outstanding securities ordinarily having the right to vote at elections of directors, unless the transaction resulting in such ownership has been approved in advance by the Continuity Directors, or (B) 50% or more of the combined voting power of the Company’s outstanding securities ordinarily having the right to vote at elections of directors (regardless of any approval by the Continuity Directors);
(d) a merger or consolidation to which the Company is a party if the stockholders of the Company immediately prior to effective date of such merger or consolidation have “beneficial ownership” (as defined in Rule 13d-3 under the Exchange Act), immediately following the effective date of such merger or consolidation, of securities of the surviving corporation representing (A) more than 50%, but less than 80%, of the combined voting power of the surviving corporation’s then outstanding securities ordinarily having the right to vote at elections of directors, unless such merger or consolidation has been approved in advance by the Continuity Directors (as defined below), or (B) 50% or less of the combined voting power of the surviving corporation’s then outstanding securities ordinarily having the right to vote at elections of directors (regardless of any approval by the Continuity Directors);
(e) the Continuity Directors cease for any reason to constitute at least a majority of the Board; or
(f) any other change in control of the Company of a nature that would be required to be reported pursuant to Section 13 or 15(d) of the Exchange Act, whether or not the Company is then subject to such reporting requirements.
For purposes of this Section 14, “Continuity Directors” of the Company will mean any individuals who are members of the Board on the Effective Date and any individual who subsequently becomes a member of the Board whose election, or nomination for election by the Company’s stockholders, was approved by a vote of at least a majority of
the Continuity Directors (either by specific vote or by approval of the Company’s proxy statement in which such individual is named as a nominee for director without objection to such nomination).
14.2 Vesting Upon a Change in Control. For Incentive Awards granted under the Plan on or after March 24, 2022, if a Change in Control occurs prior to the date on which an Incentive Award is vested and prior to the Participant’s separation from service, if such Incentive Award remains outstanding following the Change in Control (whether by substitution with another award or otherwise), and if there is a termination of the Participant’s employment or service with the Company and any subsidiary (or any successor) without “Good Cause” or without “Cause,” (as defined in any agreement between the Participant and the Company, or if not so defined, without “Cause” as defined in the Plan), or a constructive termination, including a resignation by the Participant for “Good Reason” (as may be defined in any agreement between the Participant and the Company) at any time within the twenty-four (24) months following the Change in Control, then the following shall apply:
•All outstanding Options and Stock Appreciation Rights shall become fully vested and exercisable;

![[MISSING IMAGE: sg_nikhillalwani-bw.jpg]](https://capedge.com/proxy/DEF 14A/0001104659-23-044064/sg_nikhillalwani-bw.jpg)


![[MISSING IMAGE: sg_meredithcook-bw.jpg]](https://capedge.com/proxy/DEF 14A/0001104659-23-044064/sg_meredithcook-bw.jpg)
![[MISSING IMAGE: pc_paymix-4c.jpg]](https://capedge.com/proxy/DEF 14A/0001104659-23-044064/pc_paymix-4c.jpg)


![[MISSING IMAGE: bc_captsr-4c.jpg]](https://capedge.com/proxy/DEF 14A/0001104659-23-044064/bc_captsr-4c.jpg)
![[MISSING IMAGE: bc_capnetincome-4c.jpg]](https://capedge.com/proxy/DEF 14A/0001104659-23-044064/bc_capnetincome-4c.jpg)
![[MISSING IMAGE: bc_caprevenue-4c.jpg]](https://capedge.com/proxy/DEF 14A/0001104659-23-044064/bc_caprevenue-4c.jpg)
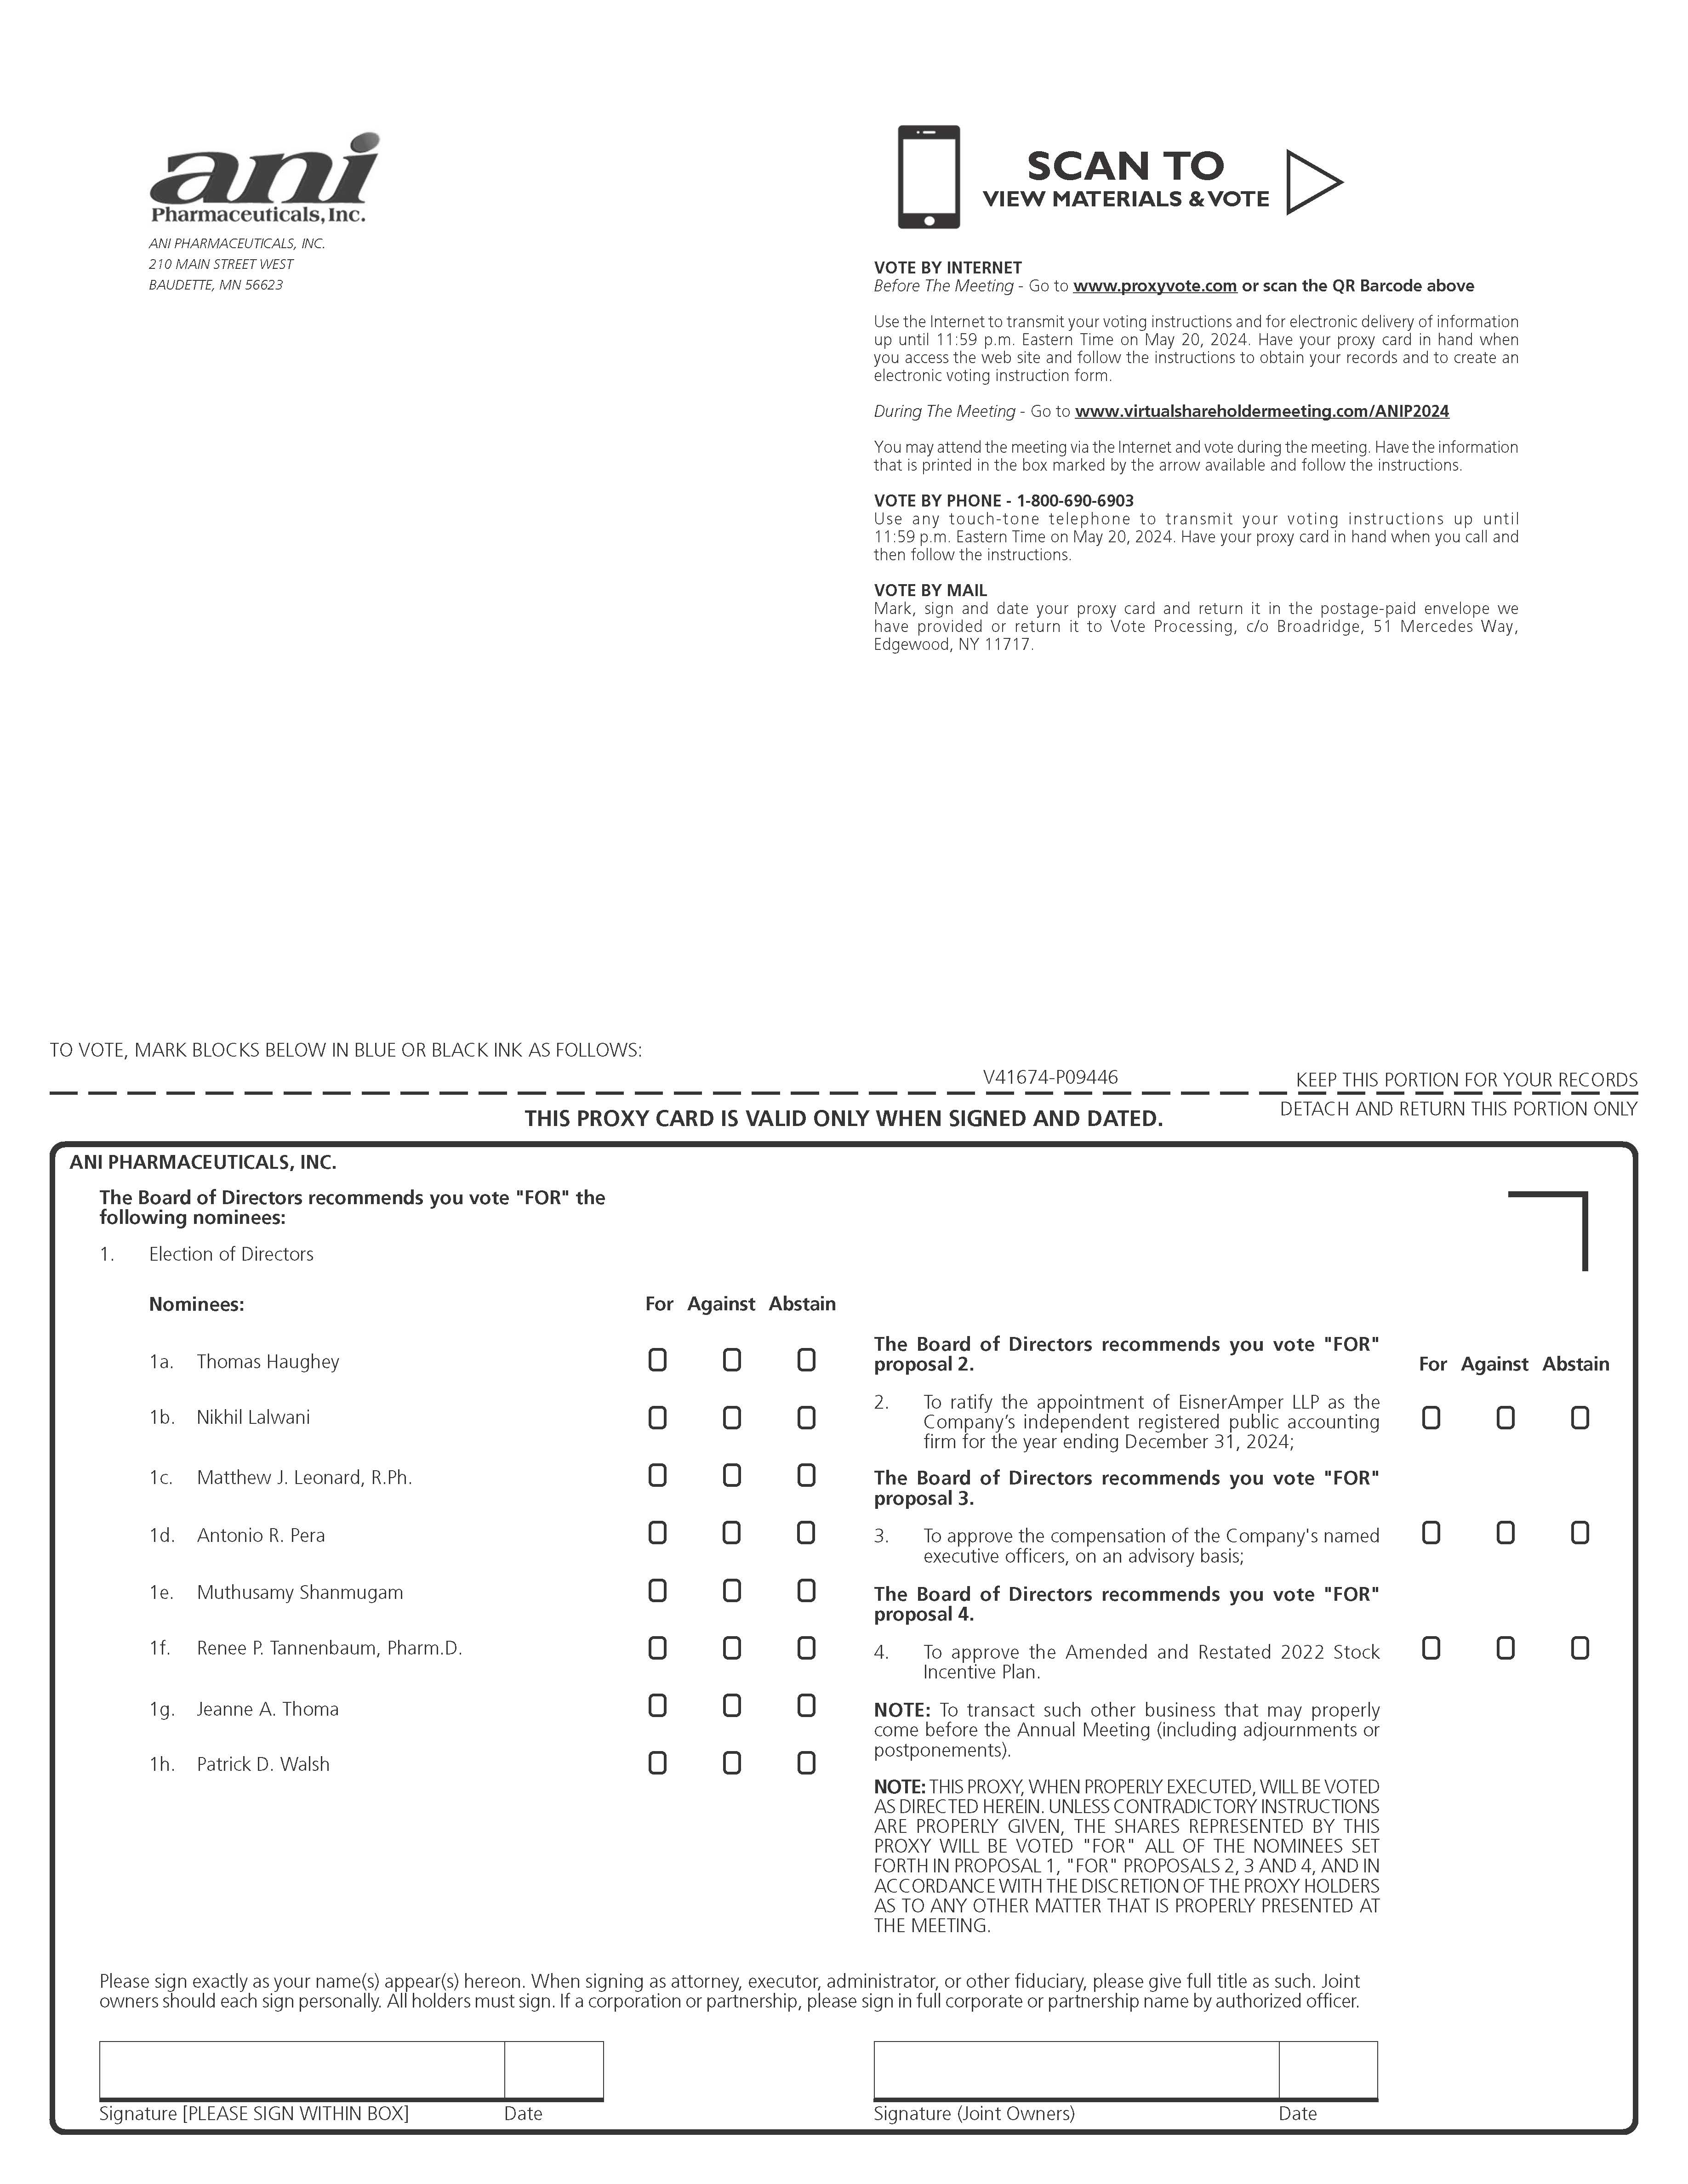
![[MISSING IMAGE: px_votepage1-bw.jpg]](https://capedge.com/proxy/DEF 14A/0001104659-23-044064/px_votepage1-bw.jpg)
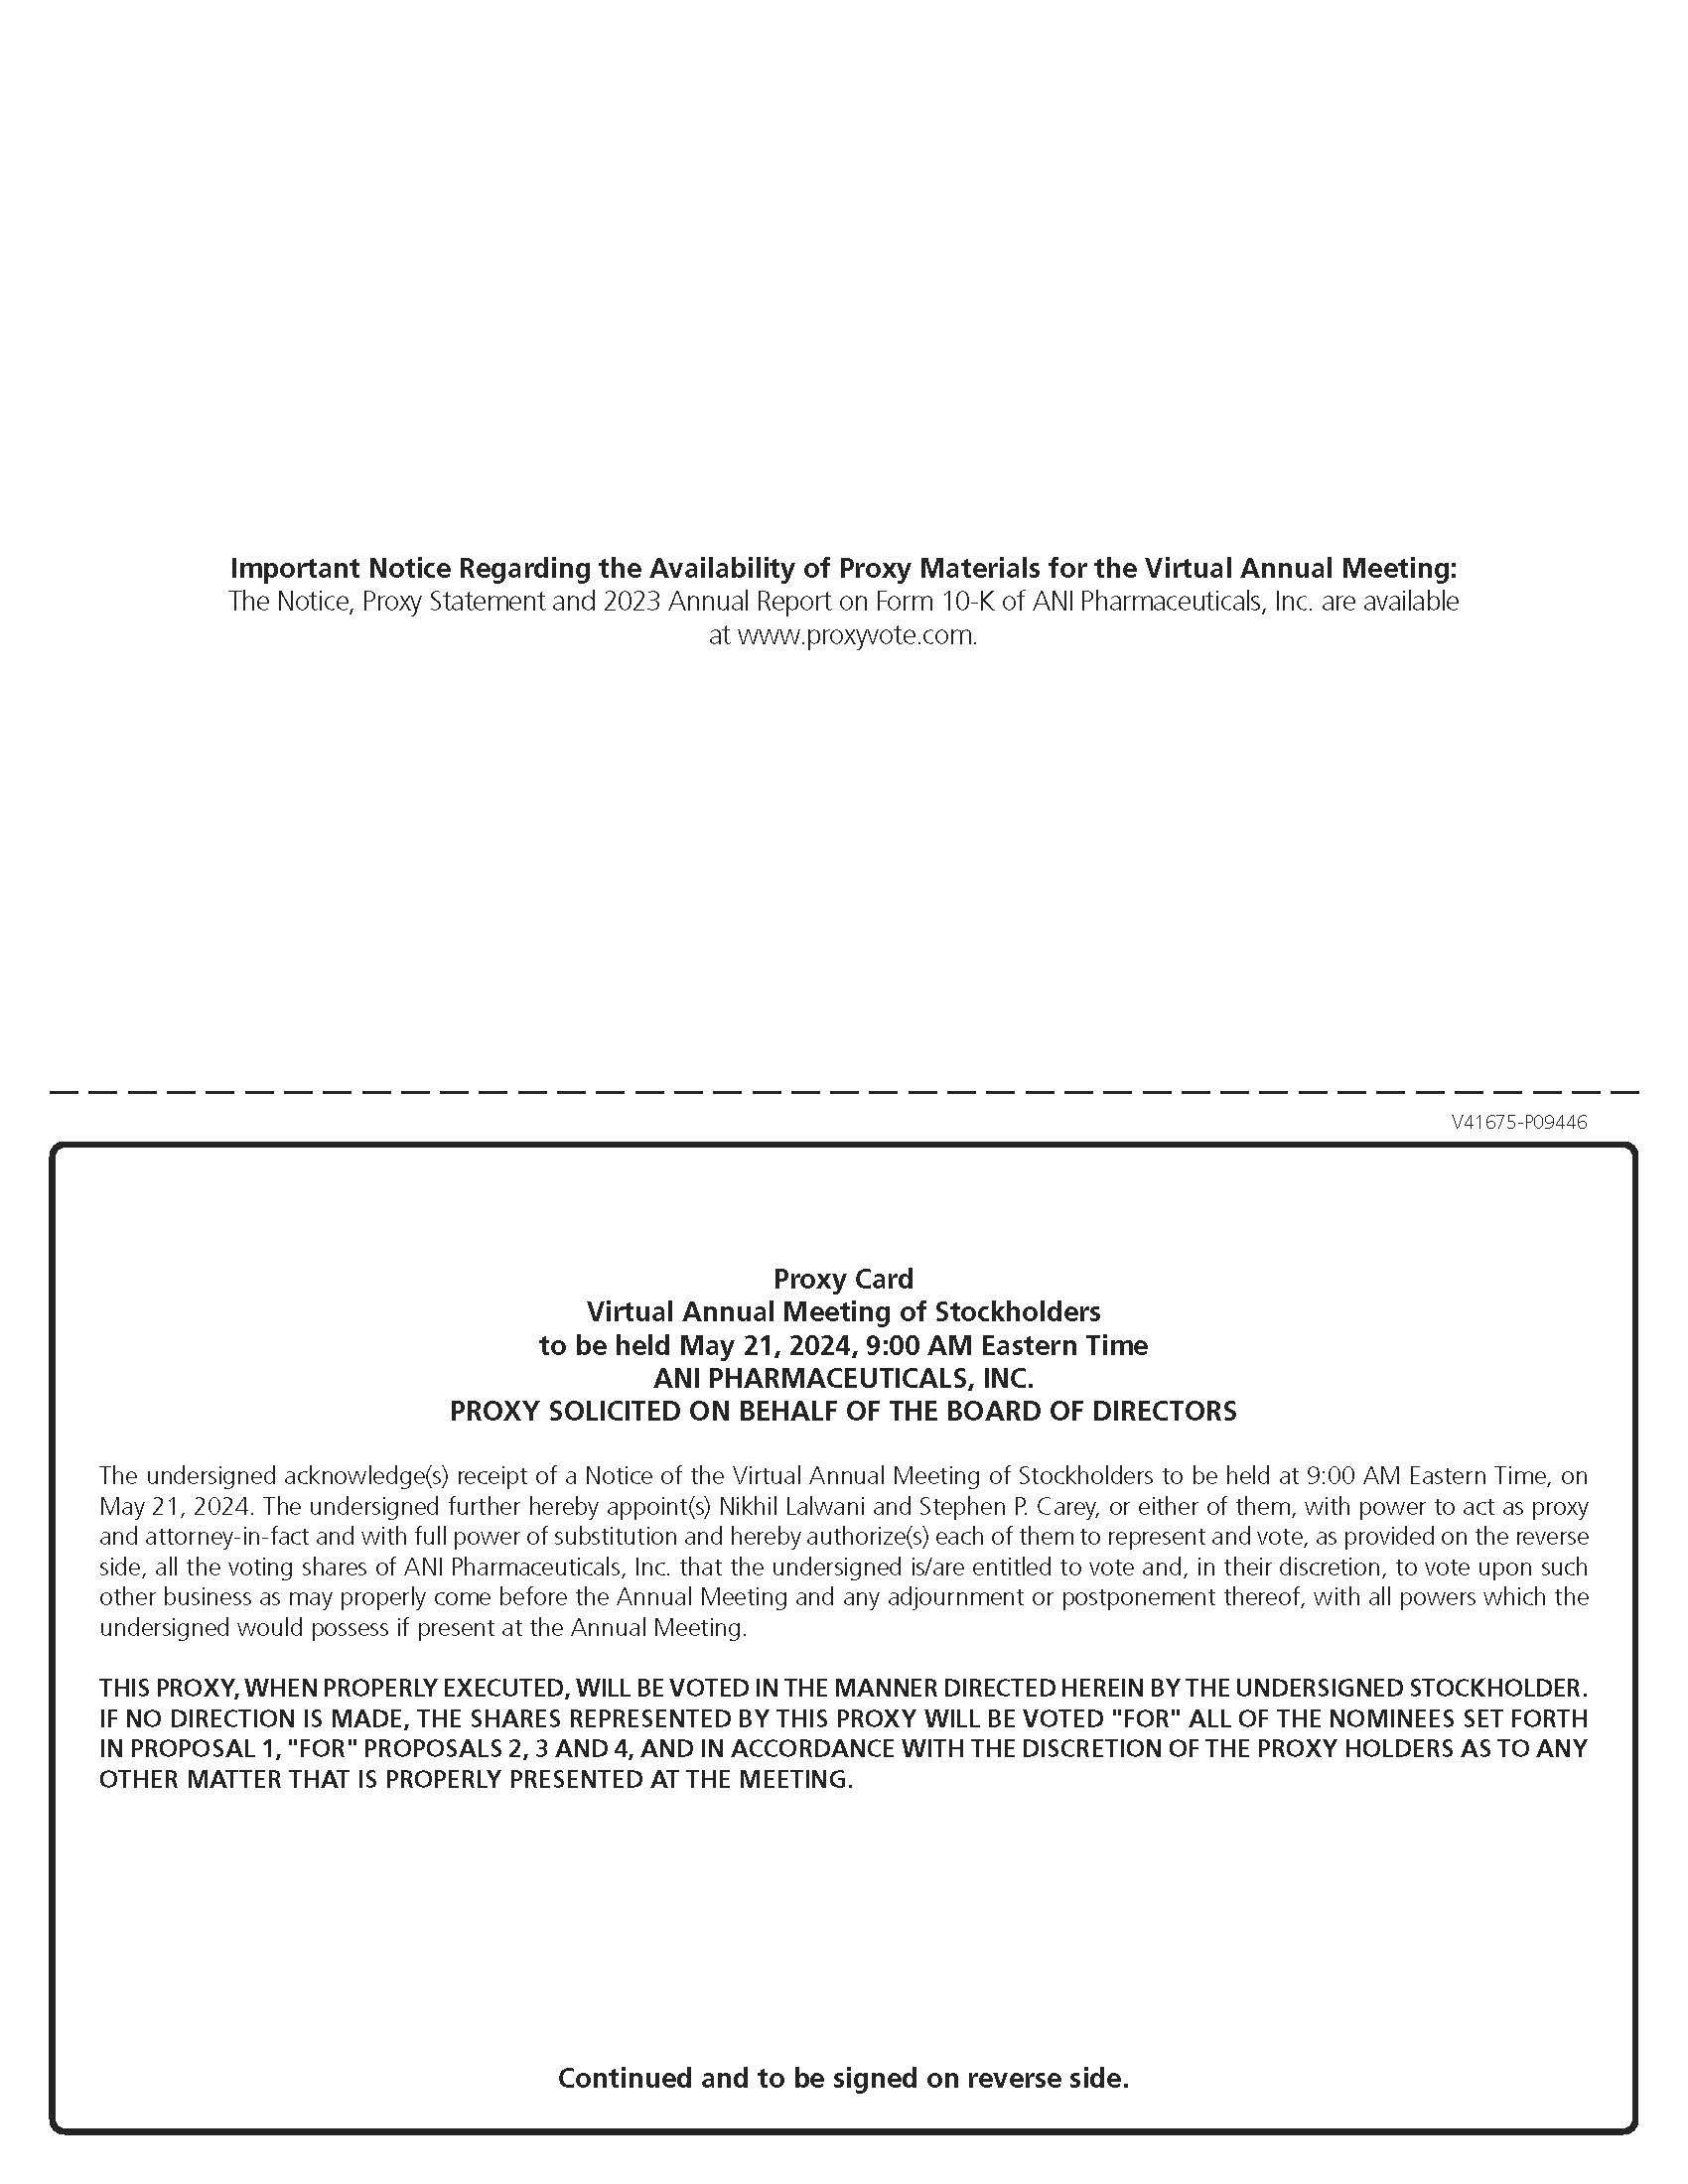
![[MISSING IMAGE: px_votepage2-bw.jpg]](https://capedge.com/proxy/DEF 14A/0001104659-23-044064/px_votepage2-bw.jpg)